
As Affordable Housing Baseline Continues to Rise, What Might "Low-Income" Mean in 2031?
A couple, at 60% AMI, might have to earn nearly $110,000 and pay $2,565+/month for a 1-BR in the project's next buildings. So, deeper affordability is needed.

Note: An Atlantic Yards 101 presentation, from the Prospect Heights Neighborhood Development Council, will be held on Tuesday, June 16, from 6:30 pm-8 pm at the Brooklyn Public Library’s Central Library. I’m out of town. But I wouldn’t be surprised if they draw on some graphics and other information I’ve published.
Key points in this article
Atlantic Yards—an arena plus 16 towers, with half of the rental units “affordable”—was sold to the public 20 years ago as providing not just a new venue for major league sports and events but also much below-market housing to combat gentrification.1
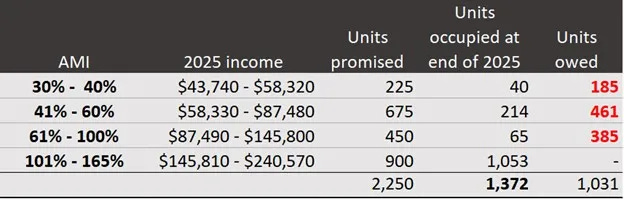
It has delivered only 1,374 of the 2,250 promised income-targeted “affordable” units, and the developers have avoided significant penalties for failing to meet a May 2025 deadline for those apartments.
Those below-market apartments built are far less affordable, in terms of the income categories served and thus the rent levels, than originally promised.
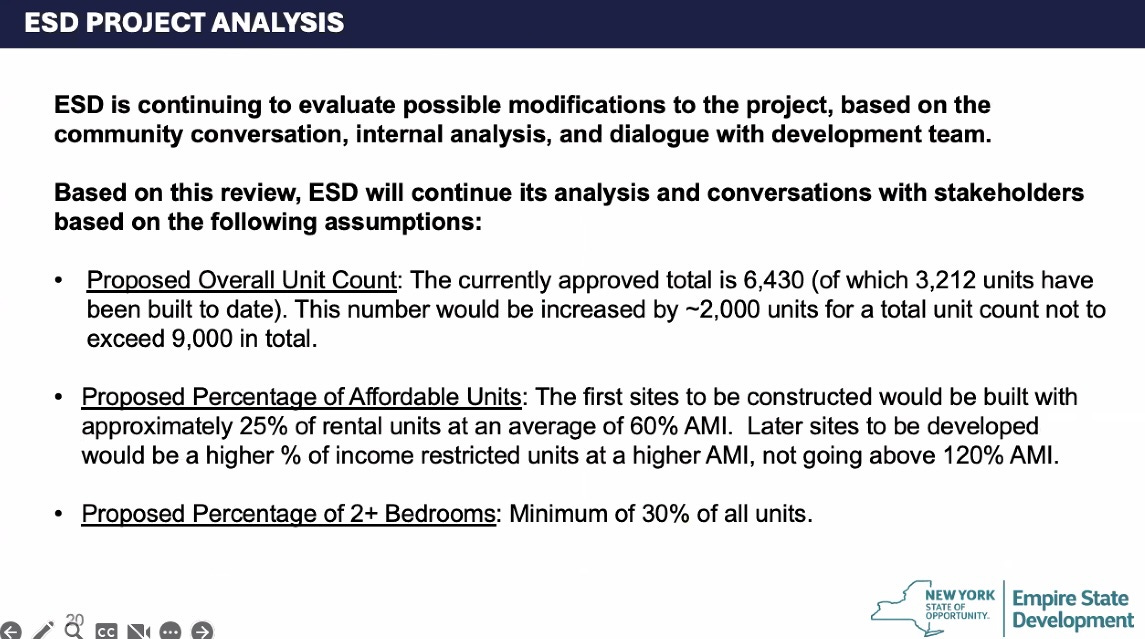
Today, with the project about half-complete, at least based on plans approved in 2006, the new developers, Cirrus Workforce Housing and LCOR, aim to supersize the project, adding 40% more total units, offering only partial details on the affordable units.
Despite 500 predicted low-income units in the first phase of new construction, averaging 60% of Area Median Income (AMI), it’s unclear how much residents must earn to qualify and what they’d pay when the buildings finally open.
I estimate that a two-person “low-income” household at 60% AMI, as of 2031, might have to earn nearly $110,000 and pay at least $2,565/month for a one-bedroom apartment. A conservative projection of incomes is below2
A conservative projection, extrapolating from the last 12 years Below, I’ve estimated the future rent for one-bedroom units in 2031, at various income levels, including that $2,565 60% AMI unit
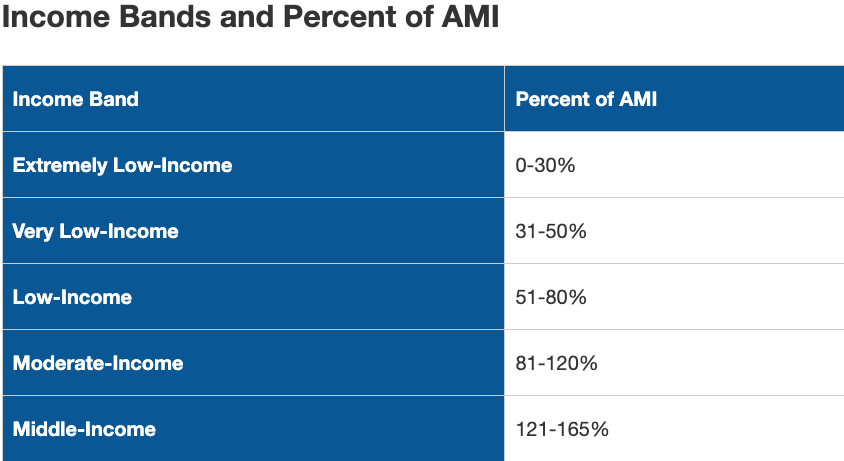
The steady rise in household income suggests a need for “very low-income” and “extremely low-income” units, for households below 50% AMI.
New York State officials, however, have relied on a questionable survey, with respondents skewing wealthier and whiter, to endorse the new developers’ focus on more costly moderate- and middle-income “affordable” units, over 80% AMI, which could mean a two-person household earning above $140,000 by 2031 and paying more than $3,400 for a one-bedroom
This isn’t set in stone, since we await, first, a Memorandum of Understanding (MOU) between the developers and New York State by July 31, then a public process, at least 18 months, before a gubernatorially-controlled body approves a revised project plan.
Affordability questions
Understanding the income targets for future affordable housing, which sets rents at approximately 30% of household income, as well as the potential costs of those apartments, requires extrapolating from current figures.
The project developers and state officials haven’t done that. So I’ll try, with the help of my frequent collaborator Ben Keel.
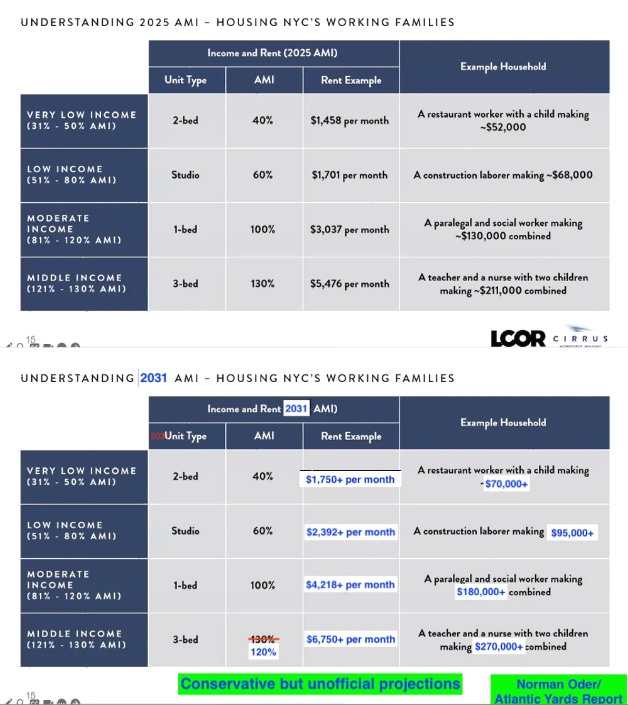
The image below mashes up a slide from a recent presentation by the developers, estimating sample rents and incomes, with my estimates for 2031.
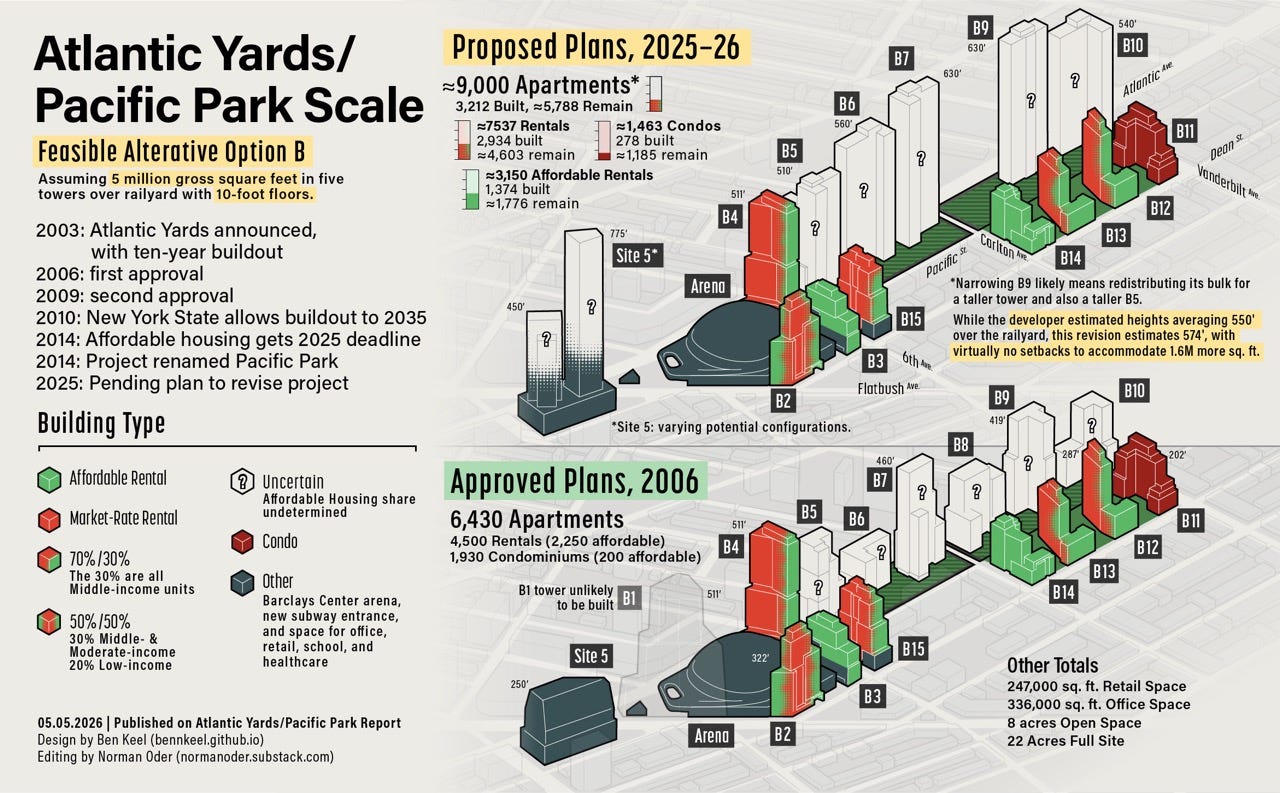
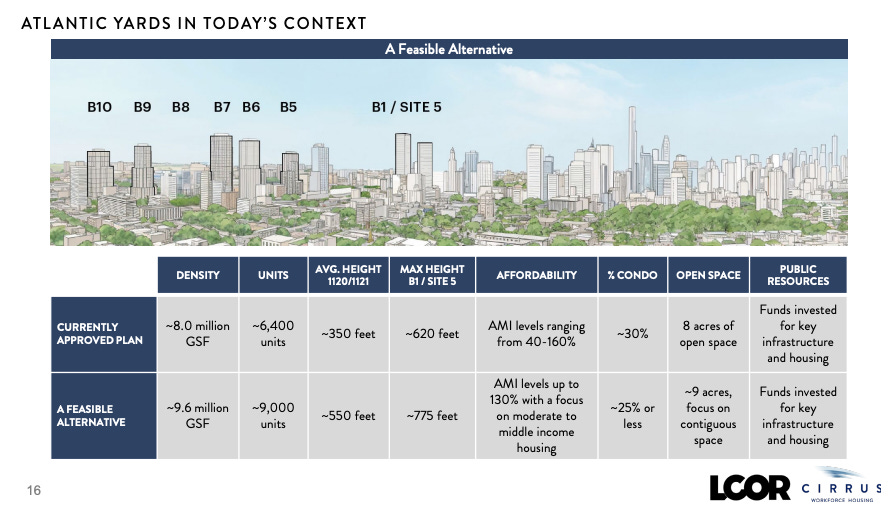
Today, 3,212 apartments have been built, about half of the 6,430 approved, though the new development team, Cirrus Workforce Housing and LCOR, now seeks to build a total of 9,000, as the graphic up top suggests.
Of 2,250 affordable units originally approved, 1,374 have been built, leaving a deficit of 876 apartments. If a larger project yields an estimated 3,150 total affordable units, that would leave 1,776 to be built.
The devil, of course, is in the details:
Who would the below-market units be for?
How much would they cost?
When would they be delivered?
After all, the longer it takes, the more that AMI, the baseline to calculate affordability, will rise.
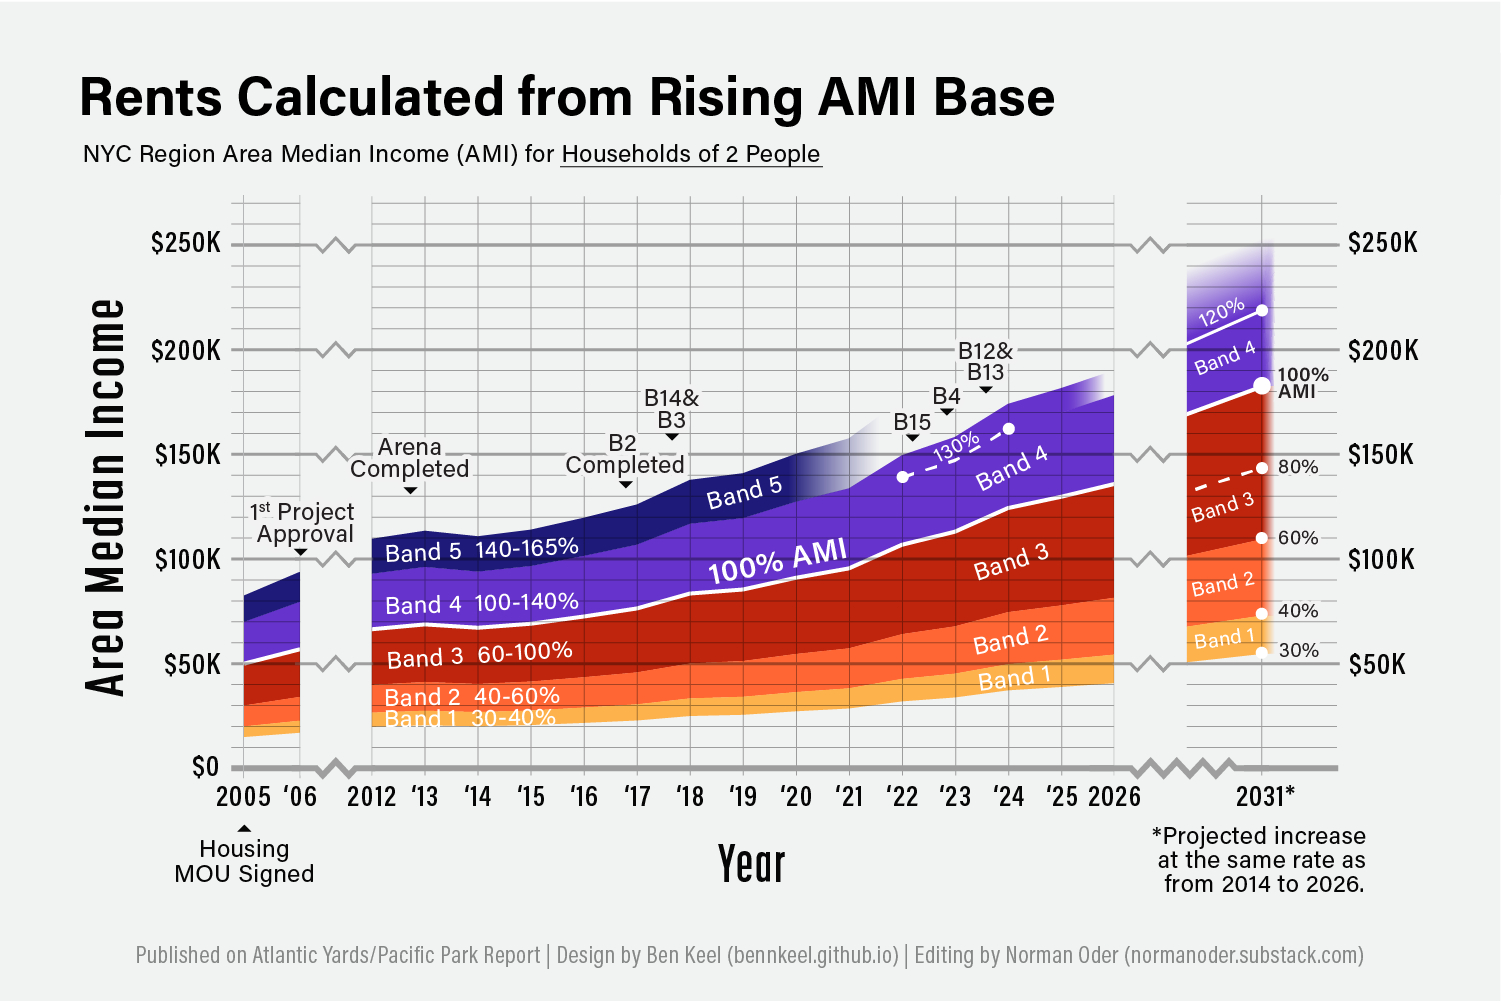
The AMI increases through 2026
The charts below show the steady increases in AMI for households of 2 and 4 people, respectively, through this year, 2026. (Further below, charts offer projections to 2031.)
Note that only the first three buildings, B2 (461 Dean), B14 (535 Carlton), and B3 (38 Sixth), have apartments for households in Band 5, the upper middle-income category, along with units in the other four income categories (or bands).
That’s because subsequent buildings, B15 (662 Pacific), B4 (18 Sixth), and B12/B13 (595 Dean), rely on the state’s 421-a tax break, which generously allows developers to qualify while only building middle-income affordable units at 130% AMI.
Hence, the dotted line indicates the 130% AMI ceiling, which is below the top of Band 4.
Also note the callout, at the far right of each graphic, for 120% AMI, the future ceiling for affordable units. That 120% AMI benchmark, as described below, will easily surpass 130% AMI levels from just a few years ago.
What’s next?
In March, we learned that the next two residential projects should have some 500 low-income affordable units, among 2,000 total apartments, according to Empire State Development (ESD), the state authority that oversees/shepherds the project.
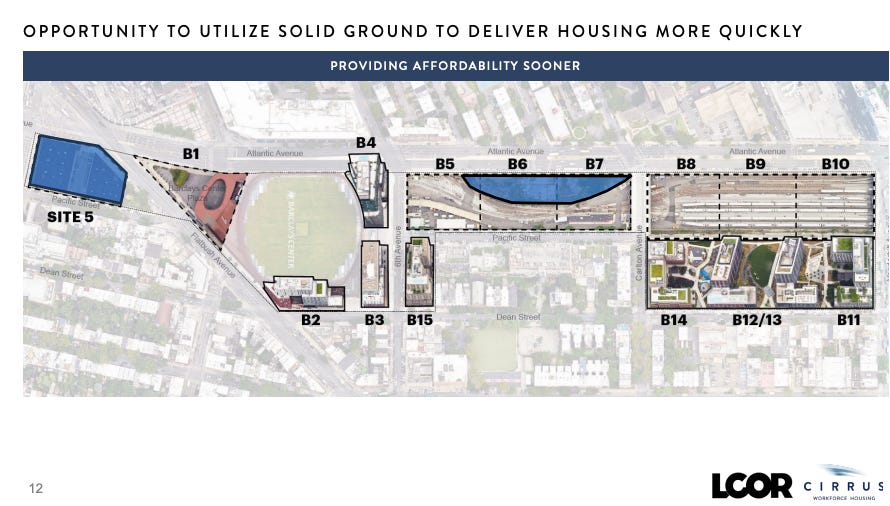
Those buildings, at the parcels known as Site 5, where two towers are planned, and B6, rely on terra firma, completely in the former example and mostly in the latter. That limits the need for the costly platform required to protect the MTA’s two-block Vanderbilt Yard, used to store and service Long Island Rail Road trains.
(New York State recently committed $175 million for the first phase of the platform, a cost that previous developers were expected to absorb. That’s half of an earlier $350 million request, suggesting the likelihood of future subsidies, just for the first block of the two-block platform, which includes the sites B5 through B7.)
The new buildings could open as soon as “the very early 2030s,” under a best-case scenario, said Joseph McDonnell of funder Cirrus Workforce Housing, which, with development firm LCOR, now controls the project.
Atlantic Yards, of course, has never reflected best-case scenarios, so we shouldn’t bet on it. I’ve estimated affordability figures as of 2031, but delays would push rents higher.
Note that at least 30% of the units should be two- and three-bedroom apartments. That’s not insignificant, but remember, the original promise was for half the units, in floor area, to be family-sized. That translates to about 35% of the unit count, and was achieved only with B3 and B14.
What does 60% AMI mean?
The plan for 500 (of 2000) apartments at 60% AMI at Site 5 and B6 reflects a business decision, not political leverage or developer generosity. That 25% affordability requirement, averaging 60% AMI, is part of the state’s 485-x tax break, crucial to making the buildings work financially.
In exchange for delivering below-market units, developers receive 40 years of tax exemptions, plus 3 years of Construction Period exemptions, for so-called Very Large Rental Projects, containing at least 150 apartments.3
Under 485-x, no more than 3 income bands are allowed, with the highest band capped at 100% AMI. So, to achieve the 60% AMI average while including 100% AMI units, the buildings would also have to include very low-income households, such as those at 30% or 40% AMI.
That’s an interesting trade-off. After all, as of 2031, a two-person household at 100% AMI might earn $180,000, while one at 30% AMI might earn nearly $55,000—again, according to conservative projections, as shown in the second-to-top graphic.
Though renters are supposed to spend about 30% of their income on “affordable” units, the percentage can vary both above and below that benchmark.
Estimating rent levels
Today, a one-bedroom apartment at 60% AMI, using 2025 figures, could rent for up to $1,822.4
By 2031, depending on the calculation, a one-bedroom at 60% AMI could rent for $2,565 to $3,071.5 That also depends on whether the income ceiling for a two-person household is closer to $110,000 or $120,000, as explained below.
Yes, everyone’s earnings will rise by 2031. Still, it’s hard to think that people earning six figures and paying that much rent qualify as low-income.
Indeed, AMI is a regional calculation, not a Brooklyn one, so it’s distorted by wealthier suburban counties. Moreover, a “High Housing Cost Adjustment” delivers higher rent levels.
That means that “very low-income” and “extremely low-income” apartments, for households below 50% of AMI, are needed to reach those most at risk.
That’s not, however, what the developers initially announced last November, as shown in the graphic below.
The developers’ “focus on moderate- to middle-income housing”—above 80% of AMI—prompted pushback from attendees at a workshop on Nov. 18 and criticism at a Dec. 2 meeting of the advisory Atlantic Yards Community Development Corporation.
They’ve since backed off, somewhat, as shown in the chart below, from a Jan. 22 presentation. While they promise a “variety of income bands including low- and middle-income units,” that remains vague.
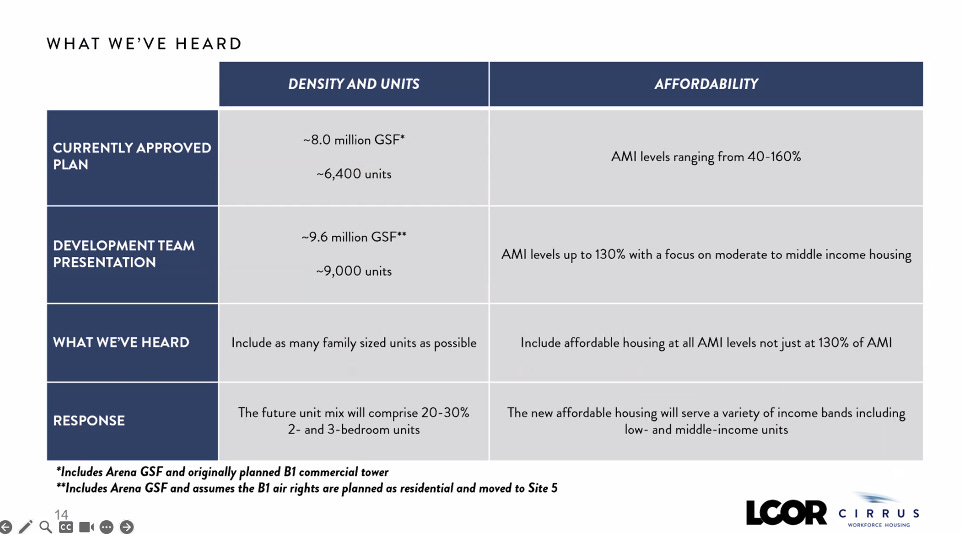
So, this statement—“Include affordable housing at all AMI levels, not just at 130% of AMI”—isn’t much of a concession.
A skewed history
After all, apartments at 130% of AMI, as in the last four buildings (B15, B4, and B12/B13), are not that affordable, even if rent levels are below market.
See below: the one-bedroom apartments, denoted by square icons, approach and then exceed $2,500 in 2022 and 2023. As of 2025, units at 100% AMI could rent for more than 130% AMI apartments two years ago.
What might it mean by 2031?6 As the chart suggests, a one-bedroom middle-income unit at 120% AMI could exceed $5,100, while a moderate-income apartment at 80% AMI could rent for more than $3,400.
A low-income unit at 60% AMI could rent for more than $2,500, while a deeply affordable, extremely low-income apartment at 30% AMI could rent for nearly $1,300.
Future increases and the skew
If, by 2031, low-income one-bedrooms at 60% AMI could rent for more than the middle-income units rented at 130% AMI in the last four buildings, what’s going on?
For one thing, the developers in the most recent buildings did not ask for the maximum rent possible, which is distorted by the previously mentioned factors.
One-bedroom units at B12/B13 were listed at $2,690 rather than the allowable $3,253, based on the developer’s market assessment. (Would developers similarly rent low-income units for less than the allowable ceiling? Or will the formula be fixed to be more realistic?)
The skew toward middle-income units departs significantly from the promises in the non-binding 2005 Memorandum of Understanding (MOU) between the original developer, Forest City Ratner, and the advocacy group ACORN: 2,250 affordable units, with 40% low-income, 20% moderate-income, and 40% middle-income.
Back then, the ceiling for low-income was 60% AMI, not 80% AMI. Also, of course, AMI levels were far lower.
Recently, the coalition BrooklynSpeaks7 has advocated that the developer “provide the missing 1,031 moderate, low- and very low-income apartments from the existing approved project density.” Local elected officials have echoed that.
State officials, led by Gov. Kathy Hochul, have not agreed. Things can change, but for now, they seem to prioritize jump-starting the project and getting a “win” (and a ribbon-cutting) rather than fulfilling promises that helped get the project approved in the first place.
The new 120% AMI ceiling
Today, the developers now recognize that 130% AMI is unrealistic. After the initial tranche of 500 apartments averaging 60% AMI, there’d be “a higher percentage of income-restricted units at a higher AMI, not going above 120% AMI,” according to the slide.
What does a higher percentage mean? We don’t know.
So the 120% AMI ceiling doesn’t reveal too much. More important are the average AMI and the timing of delivery.
Some 2025 examples
The developers tried to provide guidance, releasing the chart below at a January presentation. It’s a reasonable exercise, but it ignores the need for projections.
A two-person household earning $52,000 (technically, $51,840) and classified as very low-income at 40% AMI would pay $1,458 a month for a two-bedroom, under 2025 figures.
In 2031, the income ceiling for that income band could be over $70,000, if calculated conservatively—and close to $80,000 if calculated more speculatively, as I explain below.
If they pay 30% of their income on rent, that might mean rents of $1,750 to $2,000, as indicated in the second chart, which I adapted.8
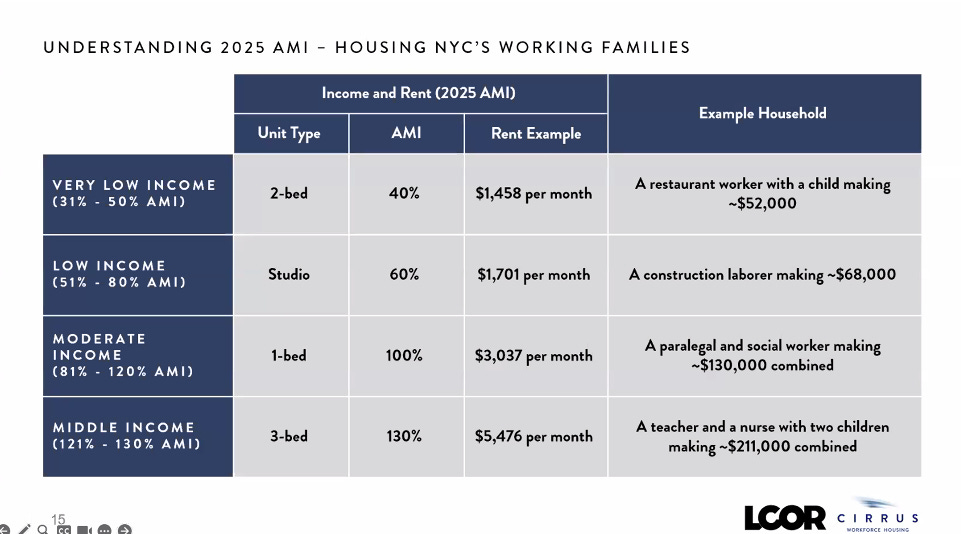
In 2025, an individual earning $68,000 (technically $68,400), at 60% AMI, would pay $1,701 per month for a studio. In 2031, as indicated by the calculations in the footnote, the rent could be at least $2,392.9
In 2025, in the chart above, a moderate-income couple earning $130,000 (technically $129,600), at 100% AMI, would pay $3,037 for a one-bedroom.
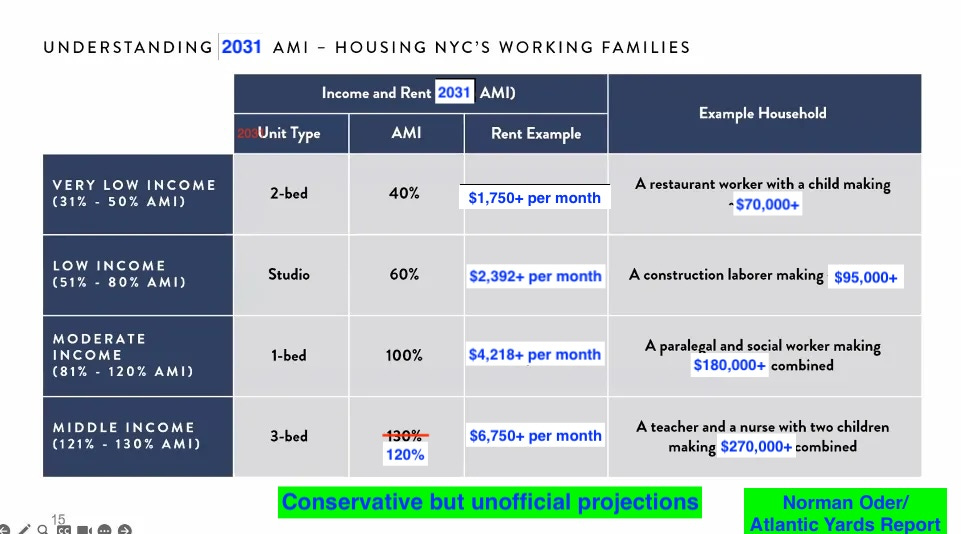
In 2031, the income ceiling for 100% AMI could be $180,000, if calculated conservatively, and close to $200,000 if calculated more speculatively, as described below. If they pay 30% of their income on rent, that could mean $4,500 to $5,000 or, as calculated in the footnote, at least $4,218/month.10
The final example in the first chart, a four-person middle-income household earning $211,000 in 2025 and paying $5,476/month for a three-bedroom, is no longer valid, because it involves a household at 130% AMI.
The new ceiling is 120% of AMI, which, by 2031, could reach $270,000 if calculated conservatively and nearly $300,000 if calculated more speculatively. If that four-person household pays 30% of their income on rent, that could mean $6,750 to $7,500 a month.11
No wonder the new developers and state officials have given up on 130% AMI as a ceiling. It’s just too far from the colloquial definition of “affordable.” So too is 120% AMI, especially when projected to 2031.
Informed projections should be part of the official record of this project. It’s misleading to rely solely on current figures.
As the callout suggests, I shouldn’t be responsible for projections. Paid consultants should show us a range.
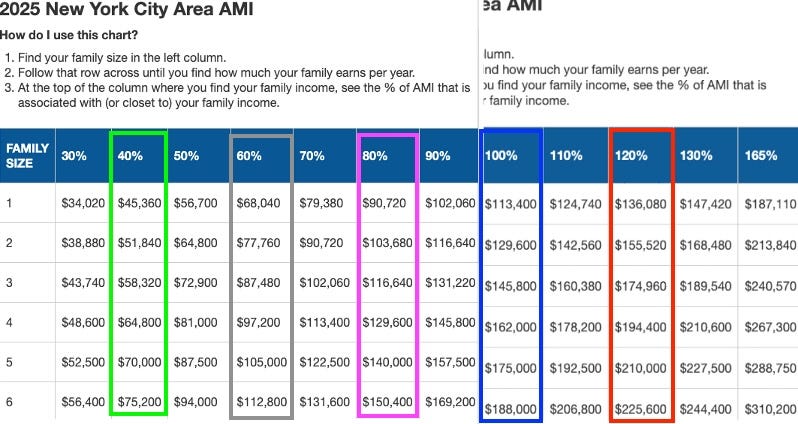
The slide above, with 2025 figures, relied on the charts—income levels and rent levels—excerpted in the footnote, from the city’s Department of Housing Preservation and Development.12
Breaking it down
My collaborator Ben Keel has created various useful charts. First, let’s look at the current income categories for households of 2 people and then 4 people.
Note that in the last four buildings constructed, the income ceiling for affordable units has been set at 130% of AMI. So Band 5 and part of Band 4 are no longer viable.
2031 projection for 2 people: conservative
I consider the chart below a conservative projection because it relies on the average increase in AMI over the last 12 years, then extrapolates to 2031.
Note how 120% AMI, the expected ceiling, is well above the 165% AMI limit for the B2, B14, and B3 towers, as well as the 130% ceiling for the four most recent buildings.
Also note how Keel’s design fades out Band 5, given that 130% of AMI within Band 4 has been the most recent ceiling, and 120% of AMI should be the future ceiling. As of 2031, the top of Band 4 fades out.
A more speculative chart is linked from the footnote.13
2031 projection for 4 people: conservative
With a four-person household, the income levels are obviously much higher. Still, this is a conservative estimate, as it extrapolates from 12 years of increases.
A more speculative chart is linked from the footnote.14
Timing and cost questions
When might the project be finished? The developers have said the end of the next decade was a best-case scenario, but again, that’s unlikely. Either way, the earlier the affordable housing is completed, the less it might cost.
But that also depends on the income bands chosen. ESD’s engagement report concluded that a top priority is maximizing affordable units “particularly for moderate and middle incomes.”
That relied on respondents to a community survey, with a self-reported median household income of $135,256, while lower-income and Black respondents were underrepresented.
In other words, rather than a sincere effort to fully understand community sentiment, it seems like a skewed sample.
If apartments in later buildings are delivered at income bands above those eligible for the 485-x tax break, ESD might issue special PILOT (payment in lieu of taxes) bonds to enable a special tax break, observed Gib Veconi, in a May 28 presentation at a meeting of the Prospect Heights Neighborhood Development Council.
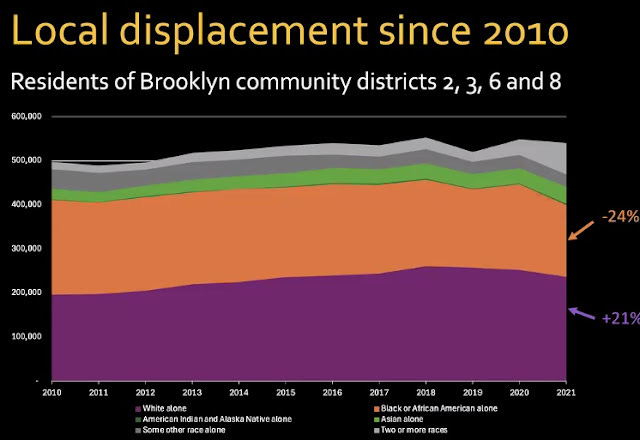
Displacement and need
Veconi, a BrooklynSpeaks leader and also a member of the advisory Atlantic Yards Community Development Corporation (AY CDC), cited a significant decrease in Black residents in the four community districts nearest the project, whose residents are supposed to gain preference in city-sponsored affordable housing lotteries.
While 30% of residents are Black, ESD’s community engagement activity reached an audience that was only 14% Black, he noted.15
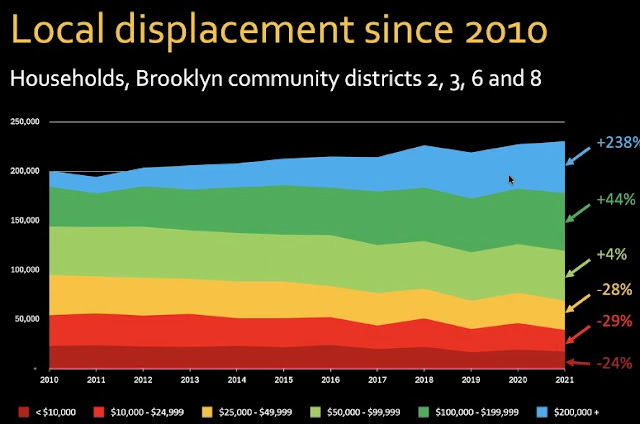
Meanwhile, as shown in the slide below, significant numbers of better-off residents have moved into the four community districts, with a small increase in moderate-income households earning between $50,000 and $100,000.
The lower-income cohorts, below $50,000 in income, have diminished, a sign of displacement.
Who needs the housing?
In the chart below, the higher-income brackets are at the bottom. The left column shows the income distribution across the four local community districts, while the second column shows the income distribution of city households who rent.
The third column shows households that are rent-burdened, spending more than 30% of their income on rent, and thus those who most need affordable housing.
As Veconi noted, the rent burden falls primarily on low-income households, with only a small share of moderate-income households.
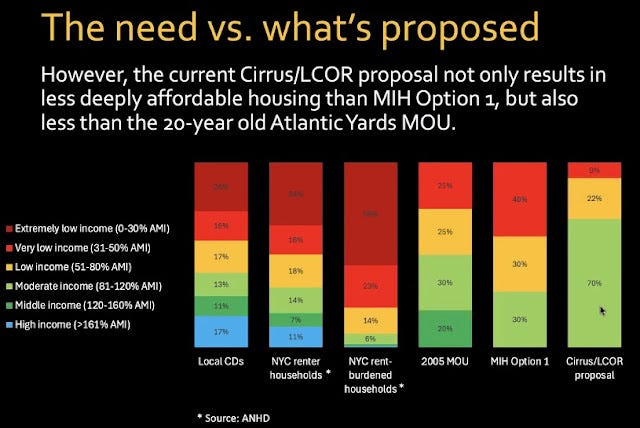
The fourth column, the configuration envisioned in the 2005 Atlantic Yards Affordable Housing MOU, “probably wouldn’t be considered adequate today by the City of New York,” Veconi observed.
That deserves some context. Yes, that MOU promised a significant amount of moderate- and middle-income housing. Then again, it also promised that half the rental units would be affordable, a higher percentage than required in local rezonings.
Of course, the Atlantic Yards developer also got other special benefits. And once condos were added, the affordability percentage was about 35%.
Under the city's Mandatory Inclusionary Housing (MIH) Option 1, required in areas that have received a valuable upzoning, Veconi said, the affordable units must primarily serve very low- and low-income New Yorkers, as well as some moderate-income residents.
MIH Option 1 requires an average of 25% affordable units, with an average AMI of 60%, reflecting what’s promised in the first buildings (and the 485-x tax break).
The new Atlantic Yards affordable housing, Veconi predicted, would be largely for the moderate-income bracket, while not addressing the deficit in low- and very low-income housing. “Most of the affordable housing,” he observed, “would target income levels for households that aren’t really experiencing any displacement pressure.”
That’s a reasonable prediction, given the developers’ claim to focus on units at 80% AMI and above. Still, the 30% low-income prediction in the Cirrus/LCOR column at the far right of his slide is uncertain.
If they’re building 1,776 more affordable units (adding 900 to the 876 in deficit), with the initial 500 averaging 60% AMI, does that mean only 30% of them are low-income?
Well, 500 is 28.2%, but some of those apartments might go to those over 80% AMI, given the ability to average, and thus not be low-income.
So it all depends on the rent range in the buildings after that, as well as the overall total of apartments, including affordable ones. As the history of Atlantic Yards shows, it’s hard to predict—even when it’s seemingly locked in.
The road not taken
In 2014, BrooklynSpeaks—with Michelle de la Uz of the Fifth Avenue Committee and Veconi negotiating, later endorsed by constituent groups—threatened a lawsuit on fair-housing grounds, getting New York State to agree to a new 2025 deadline for the affordable housing, with $2,000/month penalties for each unit not delivered.
The argument: displacement trends were such that Black residents would be pushed out before they were eligible for community preference in the affordable housing.
That deadline, however, was not honored. With 876 units not built, that could mean $1.75 million a month in damages, with the money directed to a city affordable housing trust fund.
Instead, the state, aiming to avoid a potential legal challenge, chose not to collect the funds but rather agreed to a modest $12 million in cumulative payments from the new development team.
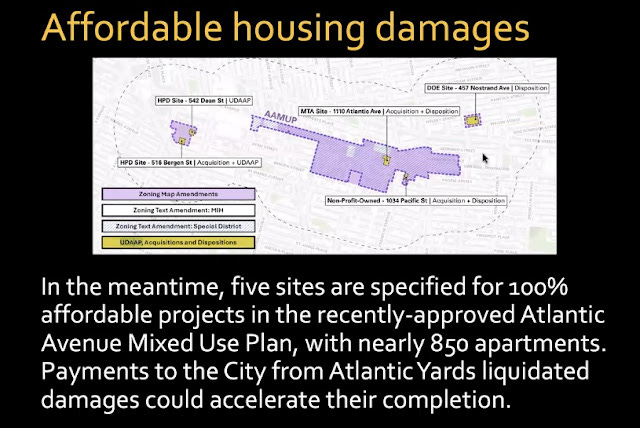
Veconi estimated that the damages could exceed $143 million if the state chooses to pursue them, and that the funds could accelerate development of affordable housing at five city-owned sites that are part of the Atlantic Avenue Mixed-Use Plan, a recent rezoning from Vanderbilt to Nostrand avenues.
“Elected officials have asked the Governor to do just that, but so far the state has not budged to collect them,” he said at the presentation.
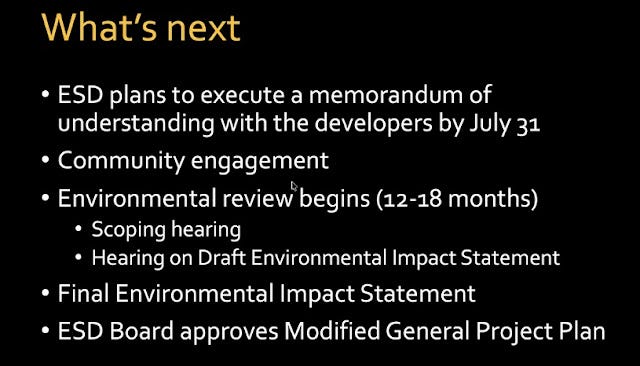
What’s coming?
By July 31, ESD plans to sign a Memorandum of Understanding with the developers that outlines public support for the project, a timeline, and the developers’ obligations.
Thyen comes a series of events, part of a required environmental review process that sometimes leads to tweaks in the project but mainly serves to make a project resistant to judicial challenge. That all could take 18 to 24 months.
“As an organization, and with our coalition partners and with elected officials, we’re working very hard to try to improve the affordable housing outcome here,” Veconi said, as well as ensuring that “a very responsible environmental review happens [to] identify issues that could be associated with putting such a dense project here.” (I’ll write separately on the density issue.)
Veconi’s presentation generated relatively little response from the 25 people or so at the PHNDC meeting. (Atlantic Yards fatigue? The attendees had other priorities?)
Still, Raul Rothblatt, a longtime Atlantic Yards activist, expressed bitterness that the state had not reached out to low-income people in the engagement process and that the below-market housing wouldn’t reach the right people.
“Something is deeply, deeply wrong about this,” he said. “It’s our job here to stand up.” He’s helping lead the workshop on Monday.
Well, the slogan was “Jobs, Housing, and Hoops,” but the 10,000 promised office jobs never materialized. The construction jobs have been numerous but intermittent, so it’s hard to see when they’ll reach, or even exceed, the 15,000 job-years estimated. Most arena jobs are part-time. The project also houses some retail jobs and building service jobs.
This relies on averaging the AMI growth rates from 2014 through 2026, which yields 6.08%, then applying that rate to the five years through 2031. So 100% of AMI for a four-person household would be $227,821, up from $169,600.
The two parcels, Site 5 and B6, are located in what the legislation calls Zone B, including the neighborhood tabulation areas Brooklyn 0602 (Site 5), Brooklyn 0801 (railyard parcels). Zone B offers three years of Construction Period benefits.
The rent levels for 2026 haven’t been released yet, though the AMI ceilings have.
$1,822 for a 1-BR in 2025 is 9.09% annual increase from $1,081 in 2019. A similar percentage increase, over six years, would yield $3,071. (The increase to 2026 should be a lesser percentage, diminishing the formula.)
An alternative calculation: $1,822 for a 1-BR in 2025 is an annual increase of 6.66% from $1,020 in 2016, over nine years. A similar annual percentage increase, over six years, would yield $2,682.
Another way to calculate it: $1,822 x 12 = $21,864. In 2025, that represents 28.1% of the $77,760 income cap for two people (and 32.1% of the $68,040 income cap for one person).
The income cap for 2031 for two people, under the conservative calculation, is $182,284 at 100% AMI, or $109,370 at 60%. Apply 28.1%, and the total of $30,783 works out to $2,565/month. So I’ll use that conservative figure.
The income cap for 2031 for two people, under my more speculative calculation, is $197,333 at 100% AMI, or $118,400 at 60% AMI. Apply 28.1%, and the total of $33,270 works out to $2,772/month.
Bottom line: a one-bedroom could cost $2,565, $2,682, $2,772, or $3,071. I’ll use the lowest figure to be conservative. Also, recognize that a delay past 2031 would increase the number.
Another way to calculate it: If we took the estimated income caps in the two scenarios, $109,370 and $118,400, and applied 30%, the monthly rent would be $2,734 and $2,960. Usually, however, the rent is calculated at a midpoint in the income band, not at the ceiling, so it would be lower.
I use 2016 as a baseline for the conservative rent calculation rather than 2014, as I did for the charts on changes in household income, because that’s the earliest official page from the city Department of Housing Preservation and Development that estimates rents. The speculative calculation starts in 2019.
My calculation of 2031 rents for one-bedroom apartments across various income bands is based on a conservative assumption that extrapolates from AMI growth over 12 years.
After calculating the income cap for each income band, I applied 28.1% (the formula for two people) to figure out the annual total rent, then divided the result by 12 to get the monthly rent.
The figures below indicate the income cap and monthly rent for different AMI levels:
120%: $218,741, $5,122
100%: $182,284, $4,268
80%: $145,827, $3,415
60%: $109,370, $2,561 [yes, this is slightly different from the $2,565 I’ve calculated separately]
30%: $54,685, $1,281
Assemblymember Jo Anne Simon, Gib Veconi of the Prospect Heights Neighborhood Development Council, and Michelle de la Uz of the Fifth Avenue Committee are the most active, unofficial leaders of the initiative BrooklynSpeaks, which has the ear of local elected officials and support, if not active involvement, of some nearby neighborhood groups. It has supplanted the now-defunct Develop Don’t Destroy Brooklyn as the main civic response to the project.
For a two-person household at 40% AMI, here’s another way of looking at it: total rent payments of $17,496 ($1,458 x 12) represent 33.75% of the 2025 $51,840 income cap.
The income cap for 2031 for two people, under the conservative calculation, is 40% of $182,284, or $72,914. Take 33.75% and get $24,608.5. Divide that by 12 to get $2,051, which is more than the $1,750 baseline I use.
For one person in 2025, 100% AMI is $113,400, and 60% is $68,040. That $113,400 is calculated by taking 70% of $162,000, which is 100% AMI for four people. Take 70% of $227,821, the four-person 100% AMI figure projected for 2031, and get $159,475. Then apply 60% to that and get $95,685 as a 2031 income ceiling.
Under 2025 figures, a one-bedroom today at 60% AMI is $1,822, a figure 107.1% of $1,701, the rent for a studio. In 2031, if two people at 60% AMI might pay $2,565/month for a one-bedroom, that’s 107.1% of $2,395.
Alternatively, someone earning $95,685 and paying 30% of income on rent would pay $28,706 a year, or $2,392/month, the number I’m using in the chart.
An alternative calculation: if in 2025 they’re paying $36,444 annual cumulative rent, that’s 28.12% of the $129,600 income cap. Apply that percentage to the 2031 projection of $180,000, and the annual total rent would be $50,616, or $4,218/month. Apply it to $200,000, and the annual total rent would be $56,240, or $4,687/month.
An alternative calculation: if in 2025 four people at 120% (not 130%) AMI are paying $5,054/month for a three-bedroom, that totals $60,648, or 31.2% of the $194,400 income ceiling. If the income ceiling rises to $270,000, the cumulative rent, 31.2% of the total, would be $84,240, or $7,020/month. But I’m using the more conservative figure.
The slides with 2025 data relied on the charts excerpted below, from the city’s Department of Housing Preservation and Development.
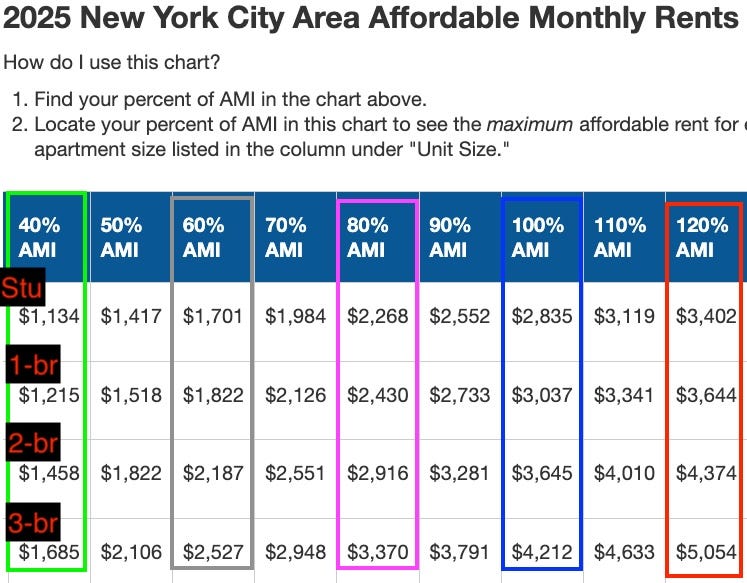
Here are the income levels from HPD.
2031 projection for 2 people: speculative
I consider the chart below more speculative because it relies on the average AMI increase over the six years 2019-2025, when the numbers climbed dramatically, and then extrapolates to 2031. Given the more modest increase from 2025 to 2026, this now seems less credible.
2031 projection for 4 people: speculative
Again, this is more speculative because it relies on the average AMI increase over six years, when the numbers climbed dramatically, and then extrapolates to 2031. Given the more modest increase from 2025 to 2026, this now seems less credible.
That’s based on self-reporting in the survey. There was no analysis of attendance at public workshops, but I don’t think the survey results were inconsistent.