


How Many Apartments Were Rented to Households Earning Under $50,000?
Well, far more than suggested in an otherwise useful table from BrooklynSpeaks. Still, middle-income units are vastly over-represented.

In November, I published, first in an article for Common Edge headlined Delays Undermine Promises of Affordable Housing in Brooklyn, a new infographic (below) by my frequent collaborator Ben Keel.
It shows not just the income categories, or "bands," but also the cost of the "affordable housing" delivered so far in the Atlantic Yards/Pacific Park buildings.
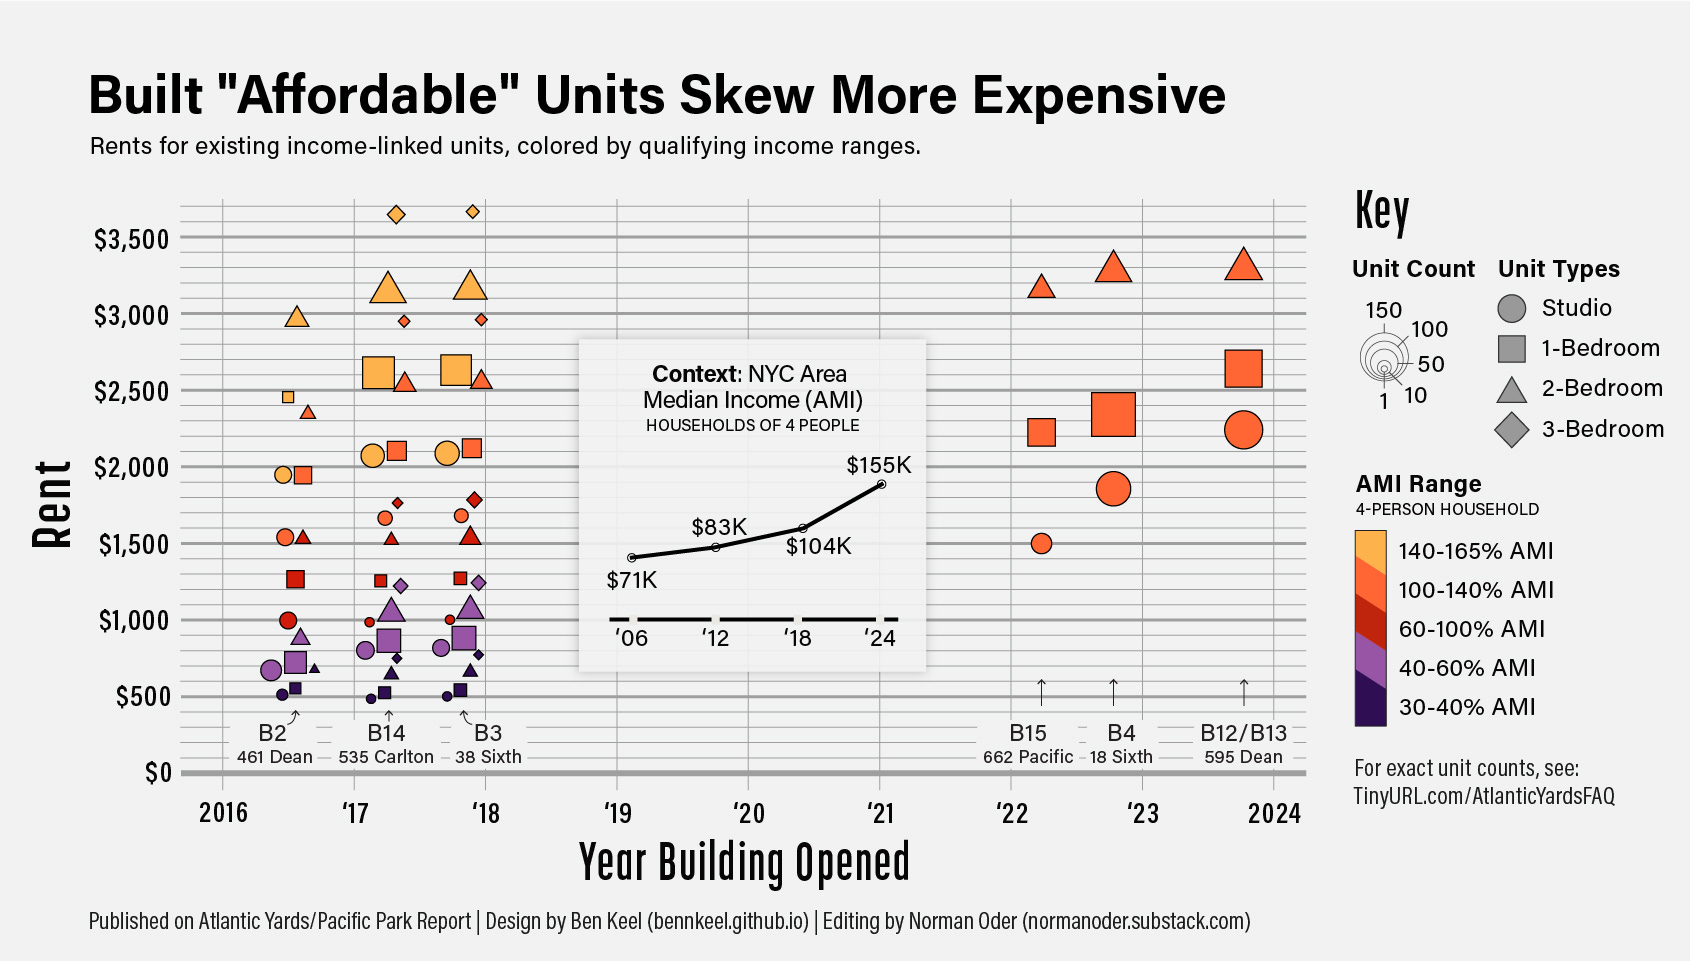
The upshot: the housing is drastically skewed to middle-income households earning six figures, notably in the four most recently constructed buildings.
There are multiple factors at work. First, the developers’ failure to deliver a mix of income ranges, as initially promised in an agreement with the advocacy group New York ACORN and then the much-hyped Atlantic Yards Community Benefits Agreement.
Then blame the developer’s New York State for drafting loose requirements for the project and for the 421-a tax break, which which green-lit buildings with "affordable" units at 130% of Area Median Income, or AMI.
Then blame rising AMI. In other words, there's a big cost to delay.
A useful but flawed table
That graphic—especially as adapted, further below—also helps us understand a flaw in an otherwise useful table produced for a December 2023 briefing by the coalition BrooklynSpeaks, which in 2014 negotiated the project's 2025 affordable deadline and has criticized the lack of deeply affordable housing.
(It also was in a more recent BrooklynSpeaks briefing for elected officials.)
That table correctly conveys that the Atlantic Yards/Pacific Park apartments built are vastly skewed to middle-income households, compared with the percentages initially promised by original developer Forest City Ratner in the 2005 Affordable Housing Memorandum of Understanding (MOU) and Community Benefits Agreement (CBA).
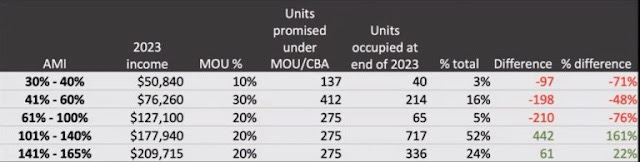
Of the 1,374 income-linked “affordable” apartments built so far (of 2,250 required), there should be, based on the MOU percentages, 10%, or 137 units, in the first category, Band 1, and 20%, or 275 units, in the fourth category, Band 4.
Instead, there have been only 40 units built in Band 1, while 717 apartments have been built in Band 4.
Again, blame the failure to lock in the 2005 promises, loose state regulation regarding affordability, and changes in subsidy and tax programs. The 421-a tax break enabled the Band 4 units in the four most recently constructed buildings.
Here’s another way of looking at it, from Empire State Development, the state authority that oversees/shepherds the project, delivered last April 18.

What’s misleading
The BrooklynSpeaks table, however, misleads, not by underplaying the lack of affordability but by going the opposite way--a casualty, I suspect, of the difficulty in conveying the nuances involved.
Notably, the income floor for households in the lowest-income category, Band 1, was significantly lower when those units were actually rented, in 2016-17, rather than as listed in 2023.
However, by supplying only the 2023 income ceilings (for three-person households), the table suggests that those in existing apartments had to earn (and pay) more than they actually did.
Rather, when those Band 1 apartments were leased, in 2016 and 2017, the AMI ceiling for a three-person household at 40% of AMI was not $50,800 but about one-third less. In 2016, it was $32,640. In 2017, it was $34,360.
By my count, after looking at the original affordable housing lottery advertisements for the buildings with lower-income units--461 Dean (B2), 535 Carlton (B14), and 38 Sixth (B3)--more than 250 apartments, in total, were rented to households, of various sizes, earning under $50,000 at the time. See details further below.
A better view
I asked graphic designer Keel to adapt his chart at the top, under the assumption that the 40 lowest-income units were leased in 2023, under the allowable rent limits cited in the above table.
See the bottom right corner of the graphic below, outlined with a dotted oval.
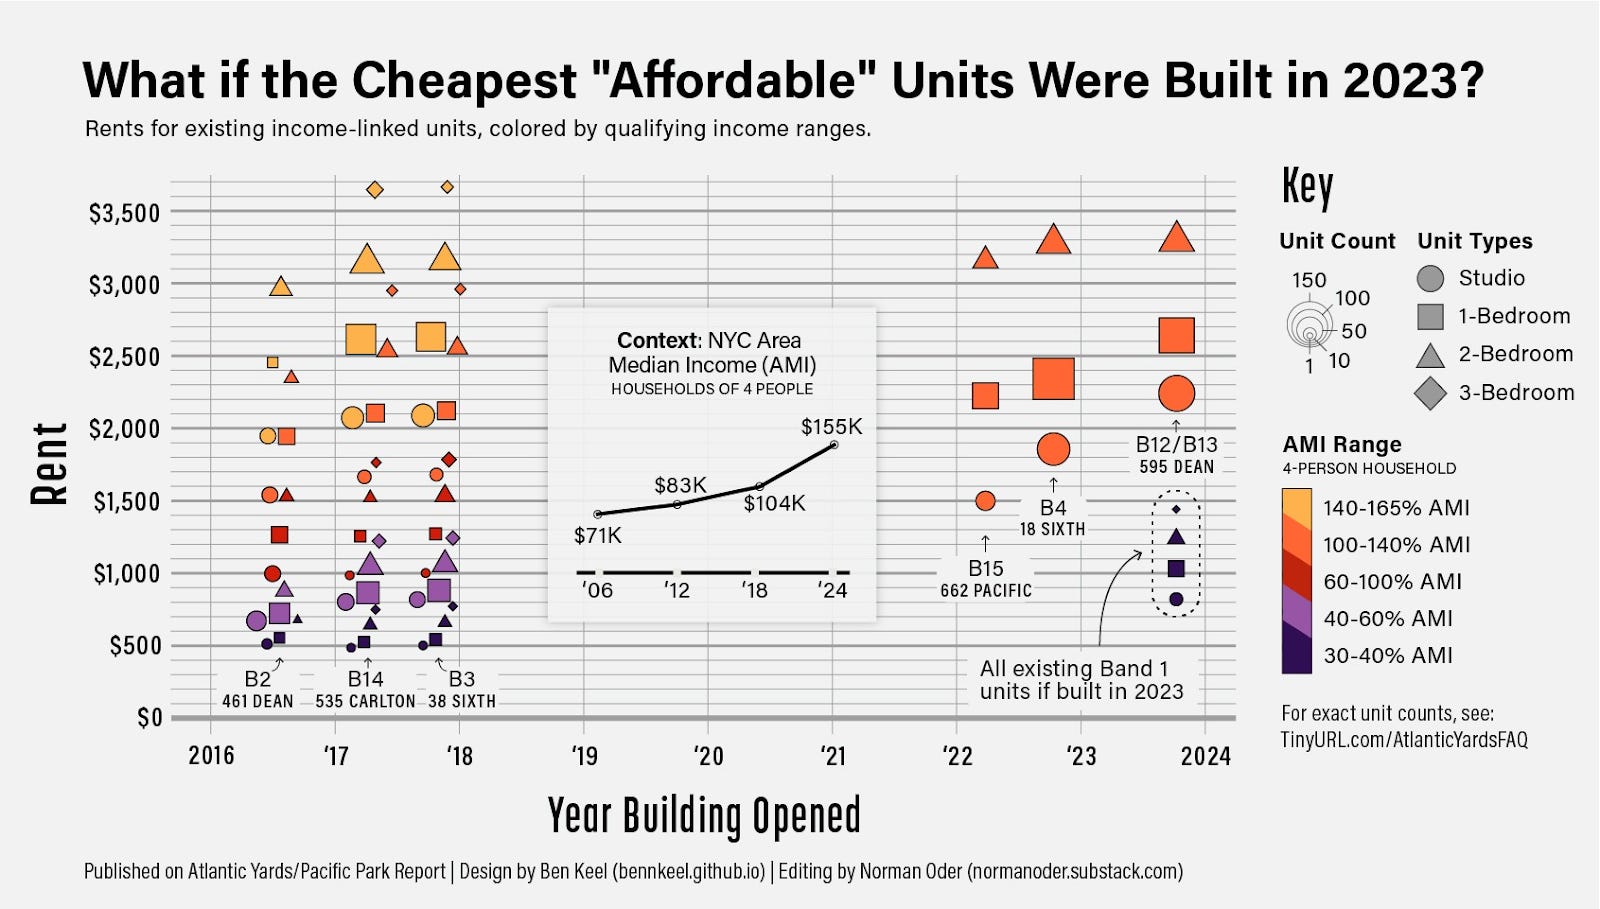
The differences are stark. As shown, the purple circle, for studios, indicates rents at $848, rather than below $559 in 2016 and 2017. The square, for one-bedrooms, indicates rents at $1,059, rather than below $600.
The triangle, for two-bedrooms, indicates rents at $1,271, rather than below $727. The diamond, for three-bedrooms, indicates rents at $1,468, rather than below $817.
Those are still far less costly than the "affordable" units actually built last year, which are in orange, indicating Band 4, the lower of the two middle-income categories.
The calculation of "affordable"
Ironically enough, those 2023 dark purple icons are closer on the chart to the orange ones than they might have been.
As I wrote, though the developer of the B12/B13 towers (595 Dean) could have charged $3,443 for one-bedroom “affordable” units at 130% of AMI, they chose $2,690, recognizing that the allowable ceiling was unrealistic, given competing market-rate units.
No wonder Brooklyn Rep. Yvette Clarke, among others, has proposed legislation to reform the AMI formula.
Addendum: the calculation
461 Dean numbers
How many units at 461 Dean were rented in 2016 to households earning under $50,840?
Well, 30 studios, 33 one-bedrooms, and ten two-bedrooms in Band 1 and Band 2. That total is 73.
Arguably, some of the 15 studios in Band 3 and 16 one-bedrooms in Band 3 were rented to people earning under that ceiling, as well. Note the categories accentuated by arrows. Let's say half of them, or 15.
So the total, for households earning under $50,840 at that building, would be 88.
535 Carlton numbers
How many units at 535 Carlton were rented to households earning under $50,840?
Well, 18 studios and 41 one-bedrooms in Band 1 and Band 2, plus four two-bedrooms and one three-bedroom in Band 1. That total is 64.

Note the categories accentuated by arrows. Arguably, some of the three studios and seven one-bedrooms in Band 3 would qualify, as well. Let's say five of the ten.
Most of the 22 two-bedrooms in Band 2 also would qualify. Let's say 18. Also, at least one of the three-bedrooms in Band 2 also would qualify.
So the total for that building would be 88.
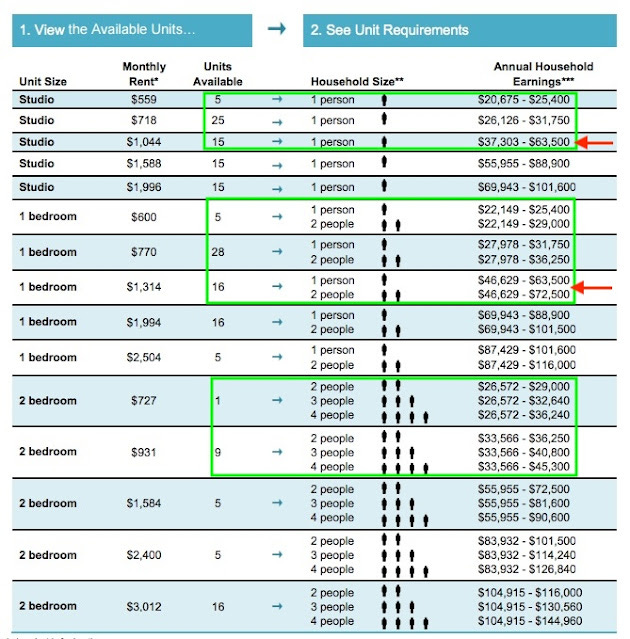
38 Sixth numbers
How many units at 38 Sixth were rented to households earning under $50,840?
This lottery advertisement has a different layout, by income category rather than unit size.
All 14 of the Band 1 units would qualify, as would 50 of the Band 2 units, the 17 studios and 33 one-bedrooms. That total is 64.
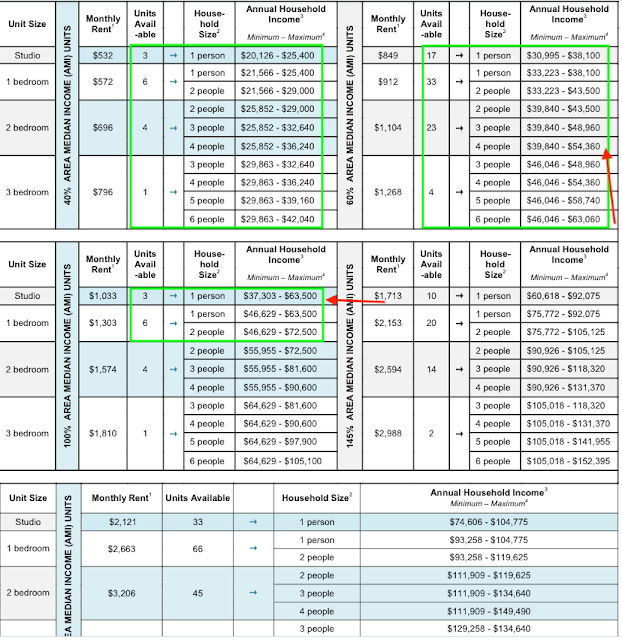
Note the categories accentuated by arrows. Most of the 23 two-bedrooms in Band 2 also would qualify. Let's say 19. And at least one of the four three-bedrooms in Band 2 also would qualify. Let's say one.
Arguably, some of the three studios and six one-bedrooms in Band 3 would qualify, as well. Let's say four of the nine.
So the total for that building would be 88.
The bottom line
That makes a cumulative total of 264.
Yes, there's some fuzziness to my estimates, so the total might have been a bit more or less. Still, it's likely more than 250.
That’s far lower than there should be. But not quite as low as some might think.