A Dive Into Affordability Prompts a Metaphysical Question
If apartments open to middle-income households rent for well below the maximum, do they qualify as moderate-income?
How are the income-linked, affordable housing units in Atlantic Yards/Pacific Park distributed, among five income categories, from low- to middle-income?
The answer: skewed toward middle-income households, many earning six figures—though perhaps slightly less skewed than previously thought.
Keep in mind that “affordable” means government-assisted housing with rents representing 30% of income, typically—though not always—below market rent. And that project boosters have long preferred vague references to “affordable” rather than drilling down.
As I’ve written, the fundamental problem is that the configuration does not come close to matching the promises in the 2005 Memorandum of Understanding (MOU)—non-binding, but much promoted—original developer Forest City Ratner signed with advocacy group ACORN.
So instead of 450 middle-income units in the fourth category (Band 4), there are already 694—and that’s with only 61% of the required 2,250 affordable units delivered.
Another is that Area Median Income (AMI), the base from which affordability is calculated, has more than doubled since the MOU was signed, and risen more than 56% since the first building opened in 2016.
The original promises
The MOU document promised 900 (40%) of the 2.,250 affordable rental apartments for low-income households, 450 (20%) for moderate-income ones, and 900 (40%) for middle-income ones.
However, of the 1,374 below-market units built so far, only 254, or 18.5%, have gone to low-income households.
Meanwhile, middle-income units are already overrepresented: 1,019 apartments in Band 4 and Band 5, or 74.2% of all affordable units. Or is it 1,043 and 75.9%? Let’s unpack that.
A confusing chart
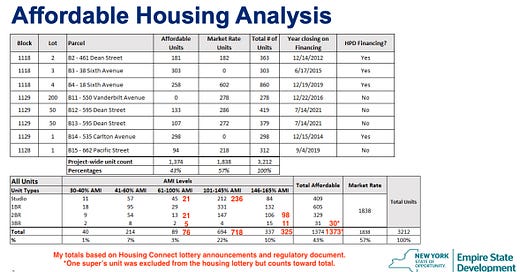
As shown by annotation below, I thought I spotted two discrepancies in the chart provided last month by Empire State Development (ESD), the state authority that oversees/shepherds the project, at the request of the advisory Atlantic Yards Community Development Corporation.
(Also, the chart does not compare the current configuration to the original promises. Nor does it acknowledge the rising AMI.)
First, as I wrote last week, the ESD total excluded a swap of eleven units between the moderate-income Band 3 (61-100% of Area Median Income, or AMI) and the middle-income Band 5 (145-165% of AMI).
That was memorialized in an amended New York City Regulatory Agreement that, reciprocally, allowed the condo building 550 Vanderbilt to be paired with 535 Carlton in a “zoning lot,” thus allowing the former an extended, and expanded, tax exemption. I called it “the ‘Zoning Lot’ Hustle.”
Both ESD and I had ignored it. That meant, in Band 3, there were eight more 2-bedroom units and three more 3-bedroom ones, leading to cumulative totals of 21 and five units, respectively. Reciprocally, in Band 5, there were eight fewer 2-bedroom units and three fewer 3-bedroom ones.
(From my annotation, it looks like four fewer 3-bedroom units, but I think one’s a super’s unit, which was never marketed in the housing lottery.)
What about the studios?
Another seeming discrepancy involved 24 studio apartments.
As my annotation above suggests, I initially counted 21 in Band 3 and 236 in Band 4, while ESD counted 45 in Band 3 and 212 in Band 4, thus making overall configuration appear somewhat more affordable.
I re-checked my math against the various Housing Connect announcements for the affordable housing lottery. (See 461 Dean, 535 Carlton, 38 Sixth, 662 Pacific, 18 Sixth, 595 Dean.)
My math wasn’t off, but the discrepancy—eliminated in the revised annotation below—relates to interpretation.
Do I agree with ESD that there are more 24 moderate-income studios than my original math? Well, tentatively, but with a big caveat, as explained below.
What happened?
I suspect that ESD classified the 24 studios initially renting for $1,547 at 662 Pacific Street (B15, aka Plank Road), as moderate-income rather than middle-income, though they were marketed, as shown in the Housing Connect notice below, to households earning up to 130% of AMI, which is middle-income.
There’s an argument for doing that.
(I queried ESD yesterday, but didn’t hear back before my deadline. Update: ESD tells me the data “was provided to ESD from the developers within the last year. ESD is currently performing due diligence in verifying these numbers.” You’d think someone there would’ve verified it already, but, then again, they don’t have much institutional memory.)
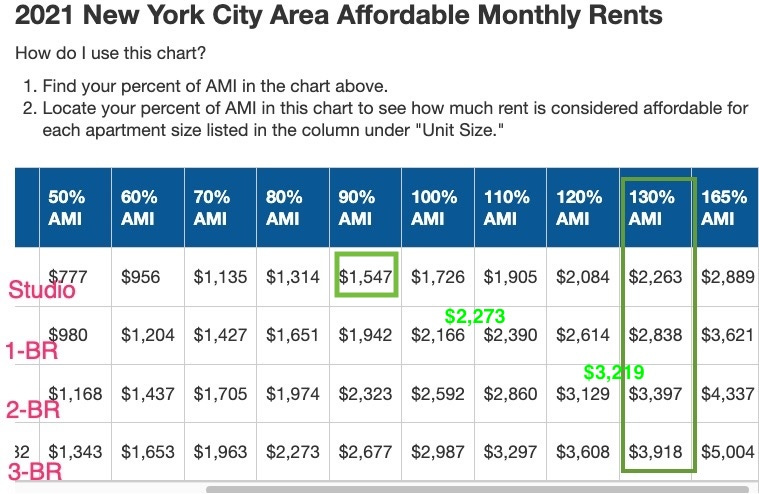
After all, the developer, The Brodsky Organization, set rents significantly below the allowable ceiling, at 90% of AMI, which is moderate income, as shown in my annotated chart below.
Meanwhile, the 1-bedroom units, with rents set at $2,273, were also well below the $2,838 ceiling, albeit still middle-income (above 100% AMI), and the 2-bedroom units, renting for $3,219, were close to the $3,397 ceiling.
Strategy, not generosity
That was strategy, not generosity, surely geared to pandemic-era shifts.
As I reported in November 2021, Brodsky executive Rick Mason explained, “The rents were set after our discussions with HPD [the city's Department of Housing Preservation and Development] and MHANY [Mutual Housing Association of New York], who is our marketing agent, regarding the current market conditions and needs in the area. We adjusted the rent levels to provide for the best possible lottery outcome. So we're hoping to get the units rented quickly."
In other words, they expected more demand for larger units and less for studios. After all, someone facing rent of $2,200 for a studio might have, at least at that time, paid less for a discounted one-bedroom or a share in a nice-two bedroom.
Since rent increases are governed by the city’s Rent Guidelines Board, those rent levels will rise slowly, as with the rest of the income-targeted rentals, and thus remain available to moderate-income renters.
The big question
This raises a metaphysical question: if the units are available to anyone earning up to 130% of AMI (middle-income), but "affordable" to households earning 90% of AMI (moderate-income), are they then considered middle-income or moderate-income?
The case for the latter: the classification reflects the rent level. Moderate-income people earning as low as $53,040 were eligible, and would pay 35% of their income, more than 30%—the standard for affordability—but not out of the question.
Total rent, at $18,564 a year, was but 17.1% of $108,680 (the maximum income for one person) and 15% of $124,150 (the maximum for two), at least at the time.
However, I could find no marketing materials, press releases, or articles explicitly stating that the studios were a relative bargain, and encouraging moderate-income households to apply.
Even a slideshow produced by MHANY, the developer’s nonprofit partner and excerpted below, noted “Income AMI: 130%,” which might have deterred some who’d otherwise qualify. It did, however, advise: “Pay Attention to: Minimum-Maximum Income Limits per Household Size.”
Will future marketing of available units stress the full income range for studios, not merely the ceiling?
Note that MHANY, formerly ACORN’s housing arm, states that its “Mission and work focused to help low & moderate income individuals and families obtain affordable rental housing or become homeowners.” It doesn’t focus on middle-income households, because they need less help.
Who took advantage?
The best way to assess the classification? Check on who actually moved in.
Until we know the income levels of those residents, we can’t say, with authority, whether the unusually low rents gave moderate-income households a foothold in the neighborhood or, rather, delivered a significant bargain to middle-income renters.
So the chart deserves an asterisk. Perhaps the AY CDC can ask for clarification.
Not the neediest
Whatever the result, the discrepancy doesn’t address the fundamental issue I described up top.
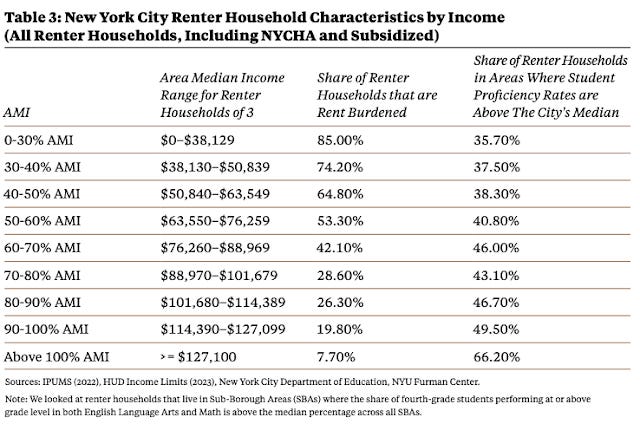
A recent chart from NYU’s Furman Center suggests that rent burdens—paying more than 30% of income for rent—decrease as income rises.
Yes, moderate-income households are somewhat rent-burdened: between 42% and 20% of them, depending on the income cohort. But they’re far better off than lower-income ones.

However, only 7.7% of middle-income households, earning over 100% of AMI, report being rent-burdened. They still might like a below-market new apartment in a prime location.
And they might have a leg up. Not everyone wants to apply via the Housing Connect system, which requires much paperwork and financial transparency. But the wide income range could give middle-income households with irregular incomes, such as freelancers, more of a cushion, if they can’t easily document every possible income stream.
Recognizing the deal
Rest assured, the relative bargain at 662 Pacific was noticed. On one forum for affordable housing seekers, an early poster wrote:
Studio rent is quite cheap for a 130% AMI, the market units don't look tiny and are all alcove. Even though I am good where I am close by, I threw my hat in, even if they charge for amenities.
Another reported:
If all the studios are alcoves, this is a steal! But TBH it seems unlikely.
In response, another confirmed:
Quick update after my viewing with them, the building and units I saw were really nice. Studios have alcoves and I believe around the same size as the market rate units.
It should be no surprise that the 24 studios, as noted by another contributor, were rented well before the 48 1-bedroom units were all taken.
A new calculation?
Note: the housing lottery for 662 Pacific was apparently extended, and most recent notice allows for 2023 income ceilings, or $128,570 for one person and $146,900 for two people.
If households earning the maximum were to qualify for the studios, they’d pay just 14.4% and 12.6% of their incomes, respectively.
I think that’s unlikely, however, and that the increase might have helped fill the larger units, which were closer to the allowable rent limits.


